运维| filebeat协同victorialog收集nginx日志
Contents
Filebeat协同VictoriaLogs收集nginx日志
介绍
- VictoriaLogs 兼容支持多种数据输入软件,Filebeat 也支持多种数据输入。
- VictoriaLogs 的Web UI很简陋,所以要用Grafana。
- VictoriaLogs 是HTTP访问是无认证的,需要套其他软件来实现。(默认端口9428)
- VictoriaLogs 的数据过期时间是全局的,所以如果有需求,只能部署多个实例。
filebeat rsyslog
Filebeat 相对Logstash 性能更好,也比VictoriaLogs 自带的rsyslog输入功能更多。
filebat nginx
filestream功能
最新版已经遗弃type:log 功能
filebeat.inputs:
  - type: filestream
    enabled: true
    paths:
      - /mnt/d/nginx/nginx_data/logs/*.log
    processors:
    - add_fields:
        fields:
          apps: nginx
output.elasticsearch:
  hosts: ["http://192.168.31.239:9428/insert/elasticsearch/"]
  parameters:
    _msg_field: "message"
    _time_field: "@timestamp"
    _stream_fields: "host.hostname,log.file.path"
nginx modules
模块功能是需要单独启用,默认支持非常多的模块,我们这里开启nginx模块
root@bdser-home:~# filebeat modules list
root@bdser-home:~# filebeat modules enable nginx
Module nginx is already enabled
root@bdser-home:~# filebeat modules list  |grep -A 2 -B 2 nginx
Enabled:
nginx
确保上面nginx模块已经开启
# vim /etc/filebeat/modules.d/nginx.yml
# Module: nginx
# Docs: https://www.elastic.co/guide/en/beats/filebeat/9.1/filebeat-module-nginx.html

- module: nginx
  # Access logs
  access:
    enabled: true
    # Set custom paths for the log files. If left empty,
    # Filebeat will choose the paths depending on your OS.
    var.paths: ["/data/nginx/logs/*.log"]

  # Error logs
  error:
    enabled: true


    # Set custom paths for the log files. If left empty,
    # Filebeat will choose the paths depending on your OS.
    #var.paths:

  # Ingress-nginx controller logs. This is disabled by default. It could be used in Kubernetes environments to parse ingress-nginx logs
  ingress_controller:
    enabled: false

    # Set custom paths for the log files. If left empty,
    # Filebeat will choose the paths depending on your OS.
#var.paths:# vi /etc/filebeat/nginx-module-filebeat.yml
filebeat.config.modules:
path: ${path.config}/modules.d/*.yml
reload.enabled: true
reload.period: 30s
setup.template.settings:
index.number_of_shards: 1
output.elasticsearch:
hosts: ["http://localhost:9428/insert/elasticsearch/"]
parameters:
_msg_field: "message"
_time_field: "@timestamp"
_stream_fields: "host.hostname,log.file.path"filebeat启动
filebeat 二进制
# filebeat -e -c /etc/filebeat/nginx-filebeat.yml - -e:代表filebeat相关状态日志输出到终端
filebeat docker
victorialogs
我们采用docker方式部署
services:
  victoria-logs-syslog:
    image: docker.io/victoriametrics/victoria-logs:latest
    container_name: victorialogs
    restart: always
    ports:
      - "9428:9428"
      - "29514:29514"
      - "514:514/udp"
    volumes:
      - /data/victorialogs/vlogs:/victoria-logs-data
    command:
      - '-syslog.listenAddr.udp=:514'
      - '-syslog.listenAddr.tcp=:29514'
      - '--retentionPeriod=300d'
grafana
这里我们采用docker 方式部署
version: "3.9"
services:
  grafana:
    image: grafana/grafana:12.0.2
    volumes:
      - "/mnt/d/grafana/logs:/var/log/grafana"
      - "/mnt/d/grafana/etc:/etc/grafana"
      - "/mnt/d/grafana/data:/var/lib/grafana"
      - "./provisioning:/etc/grafana/provisioning"  # 为了安装victorialog的data source插件的配置文件

    environment:
      - GF_SECURITY_ADMIN_PASSWORD=123456
      - GF_INSTALL_PLUGINS=victoriametrics-logs-datasource # 在线安装
    ports:
      - "3000:3000"
    container_name: grafana
    restart: always
需要在grafana安装目录这里新建目录 provisioning/datasources
# cd /mnt/d/grafana
# cat ./provisioning/datasources/v1.yml
apiVersion: 1
datasources:
# <string, required> Name of the VictoriaLogs datasource
# displayed in Grafana panels and queries.
- name: victorialogs
# <string, required> Sets the data source type.
type: victoriametrics-logs-datasource
# <string, required> Sets the access mode, either
# proxy or direct (Server or Browser in the UI).
access: proxy
# <string> Sets URL for sending queries to VictoriaLogs server.
# see https://docs.victoriametrics.com/victorialogs/querying/
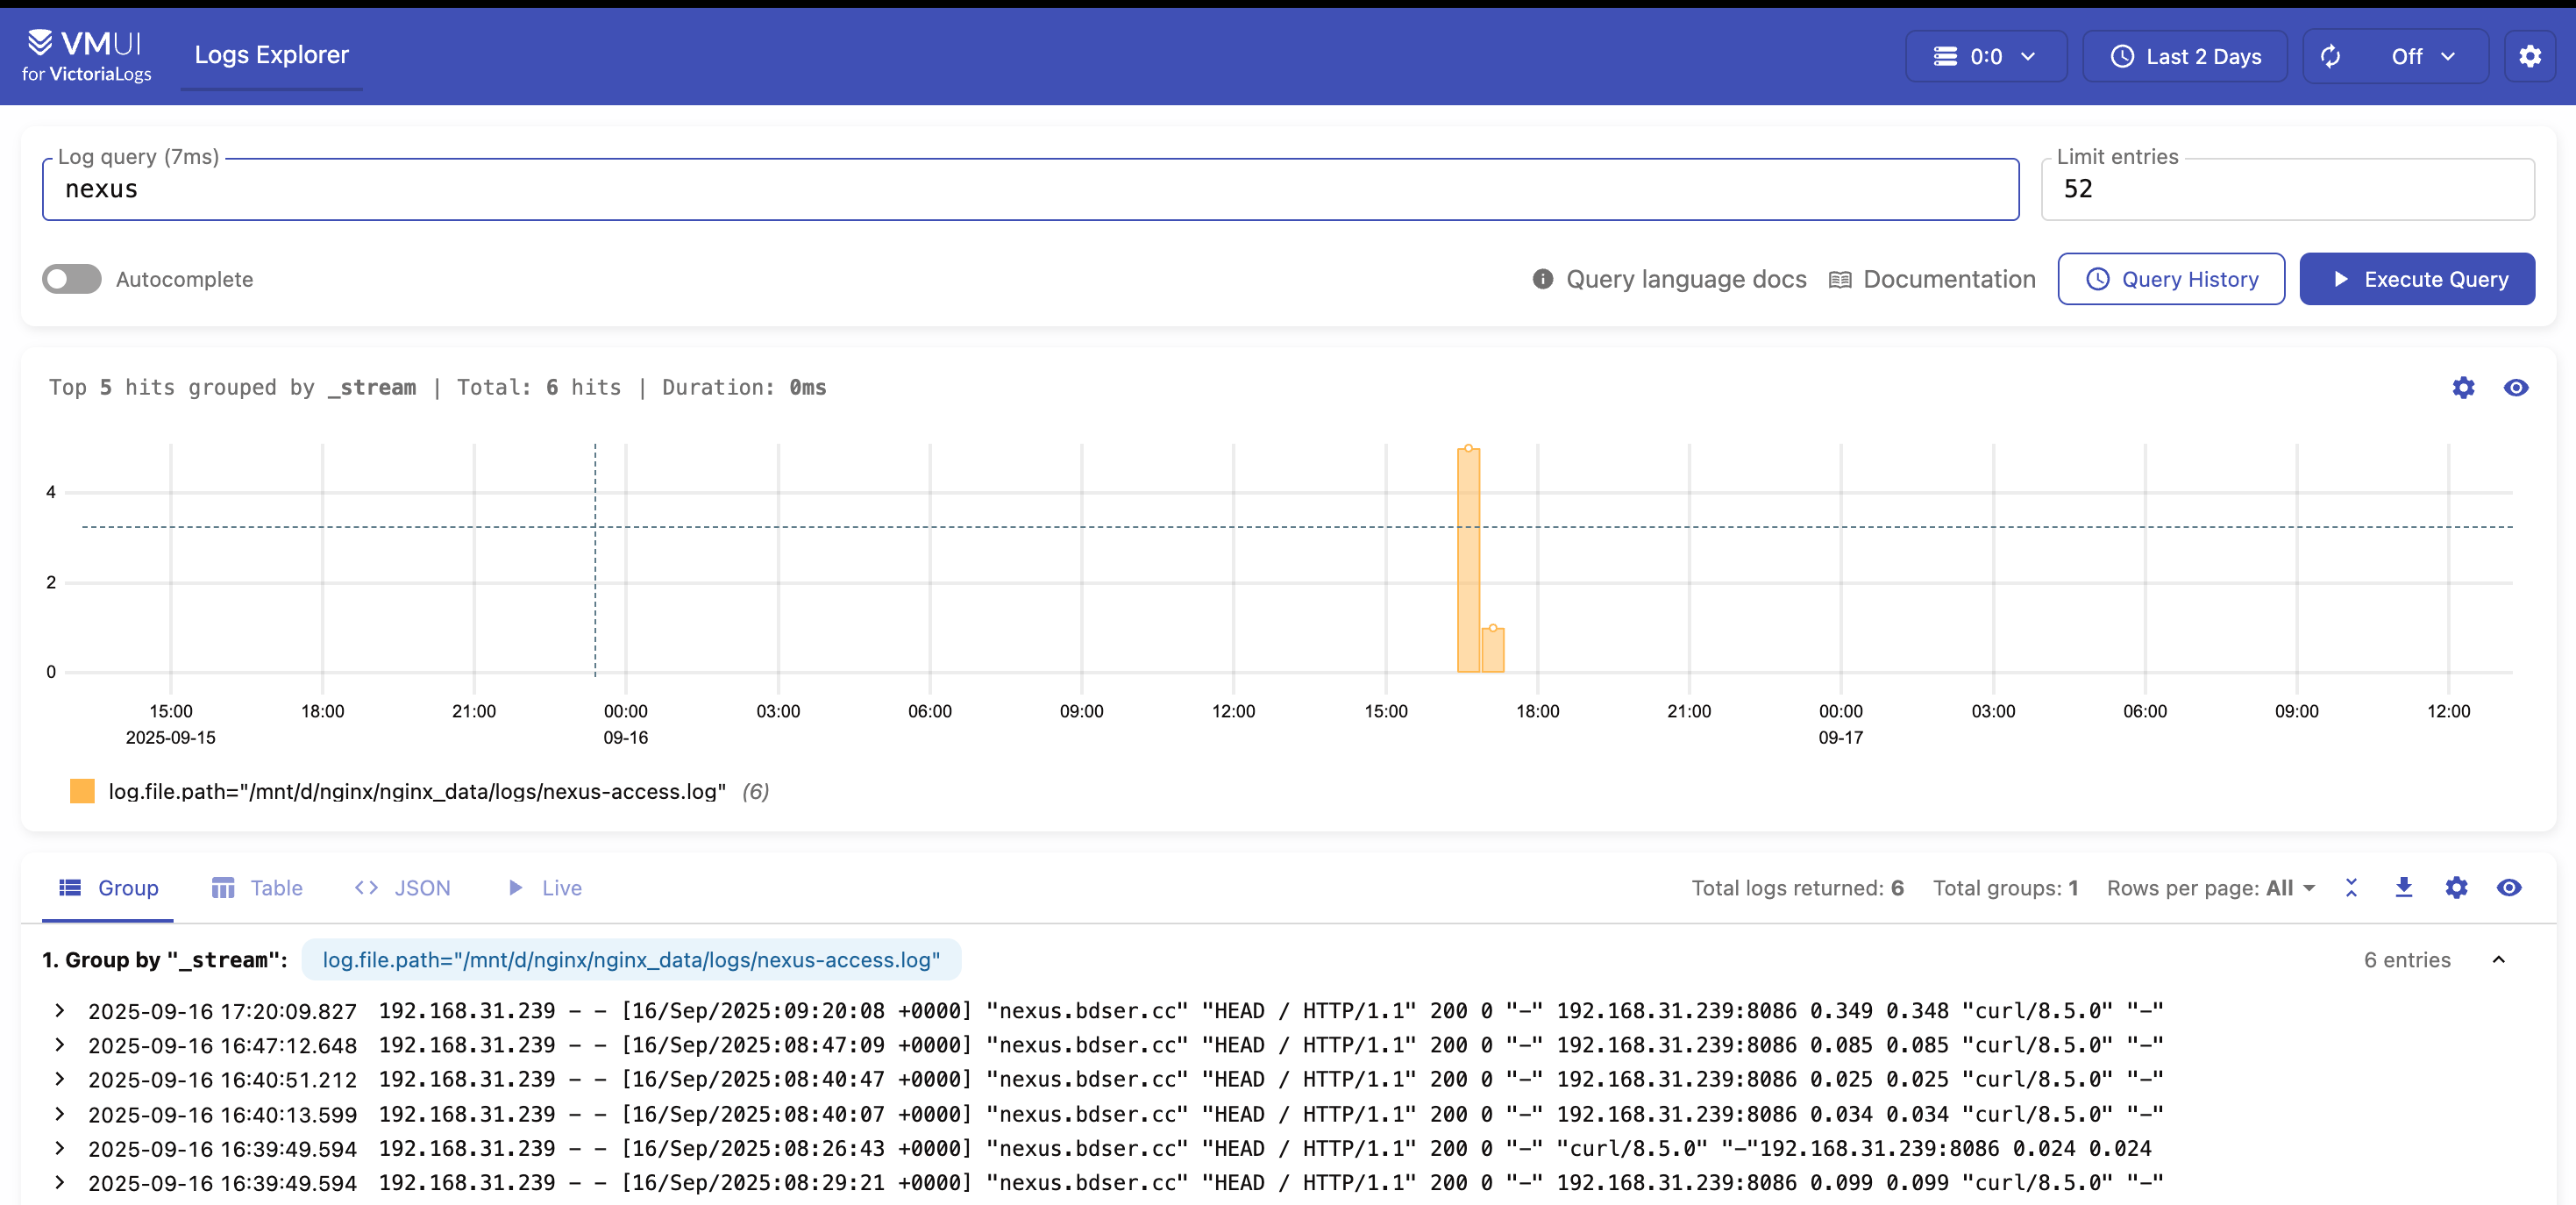
url: http://192.168.31.239:9428victorialog服务器日志展示
victorialog 自带UI界面
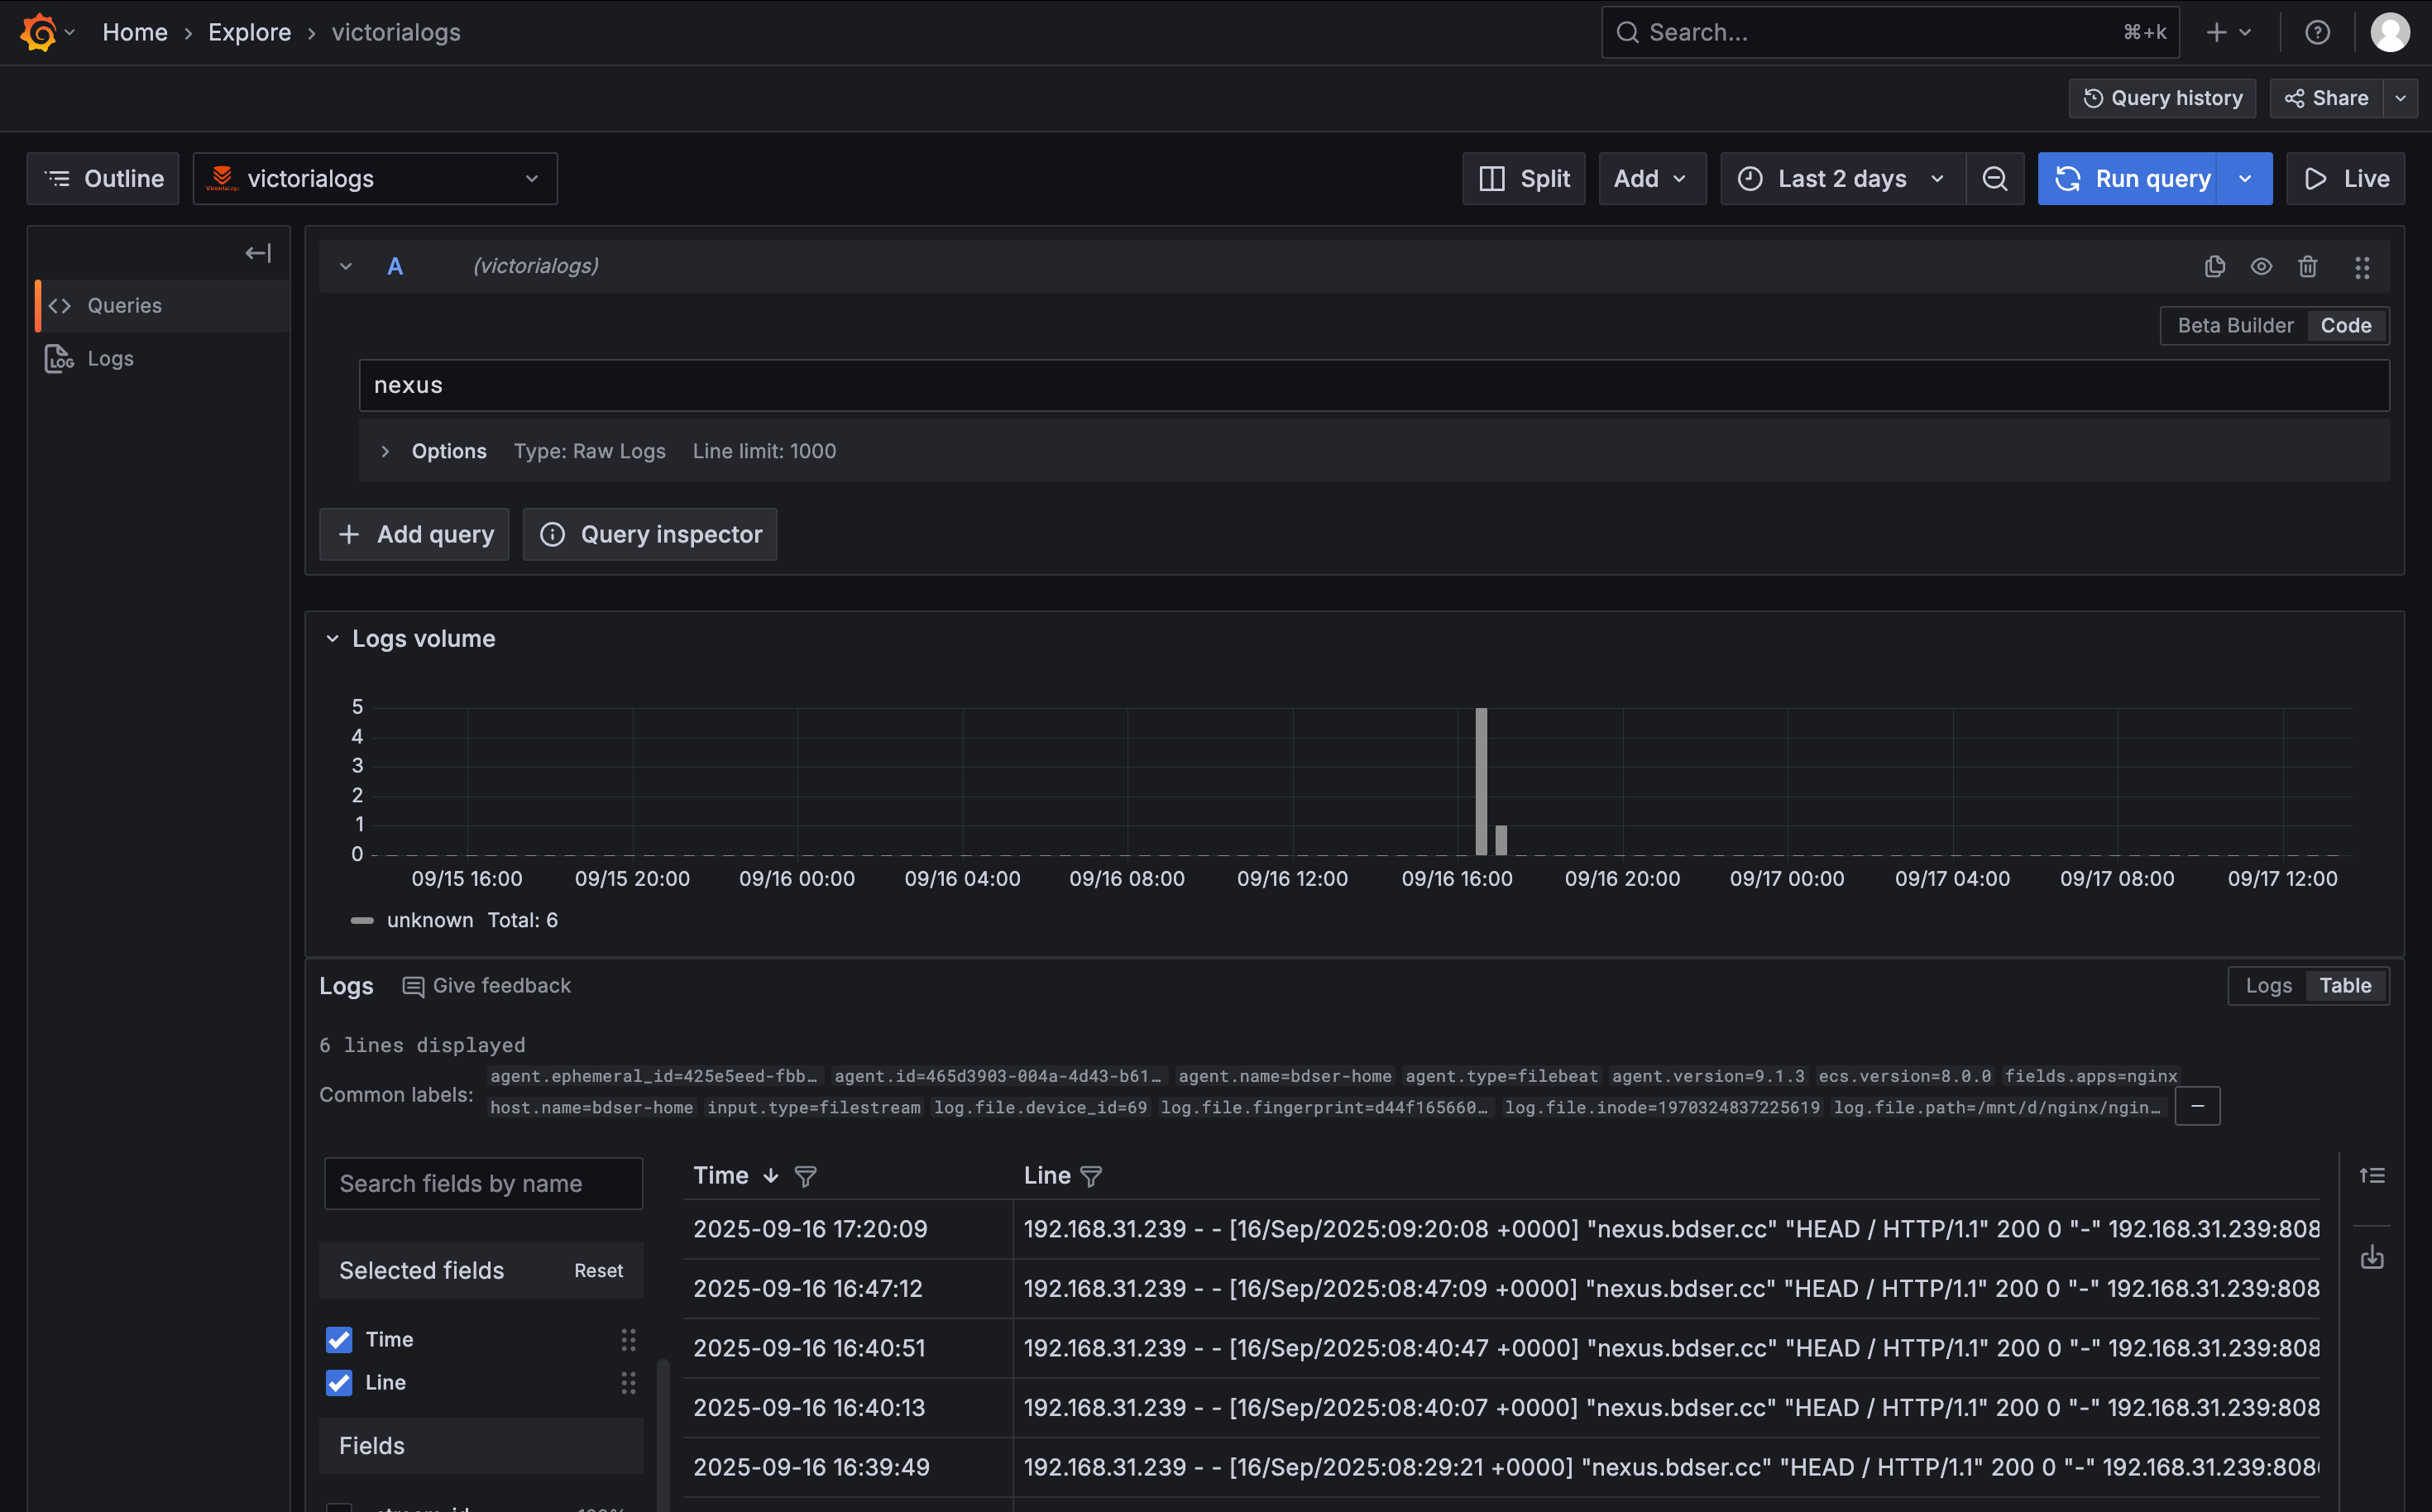
nginx日志通过filebeat已经接入到victorialog里面
grafana 界面展示
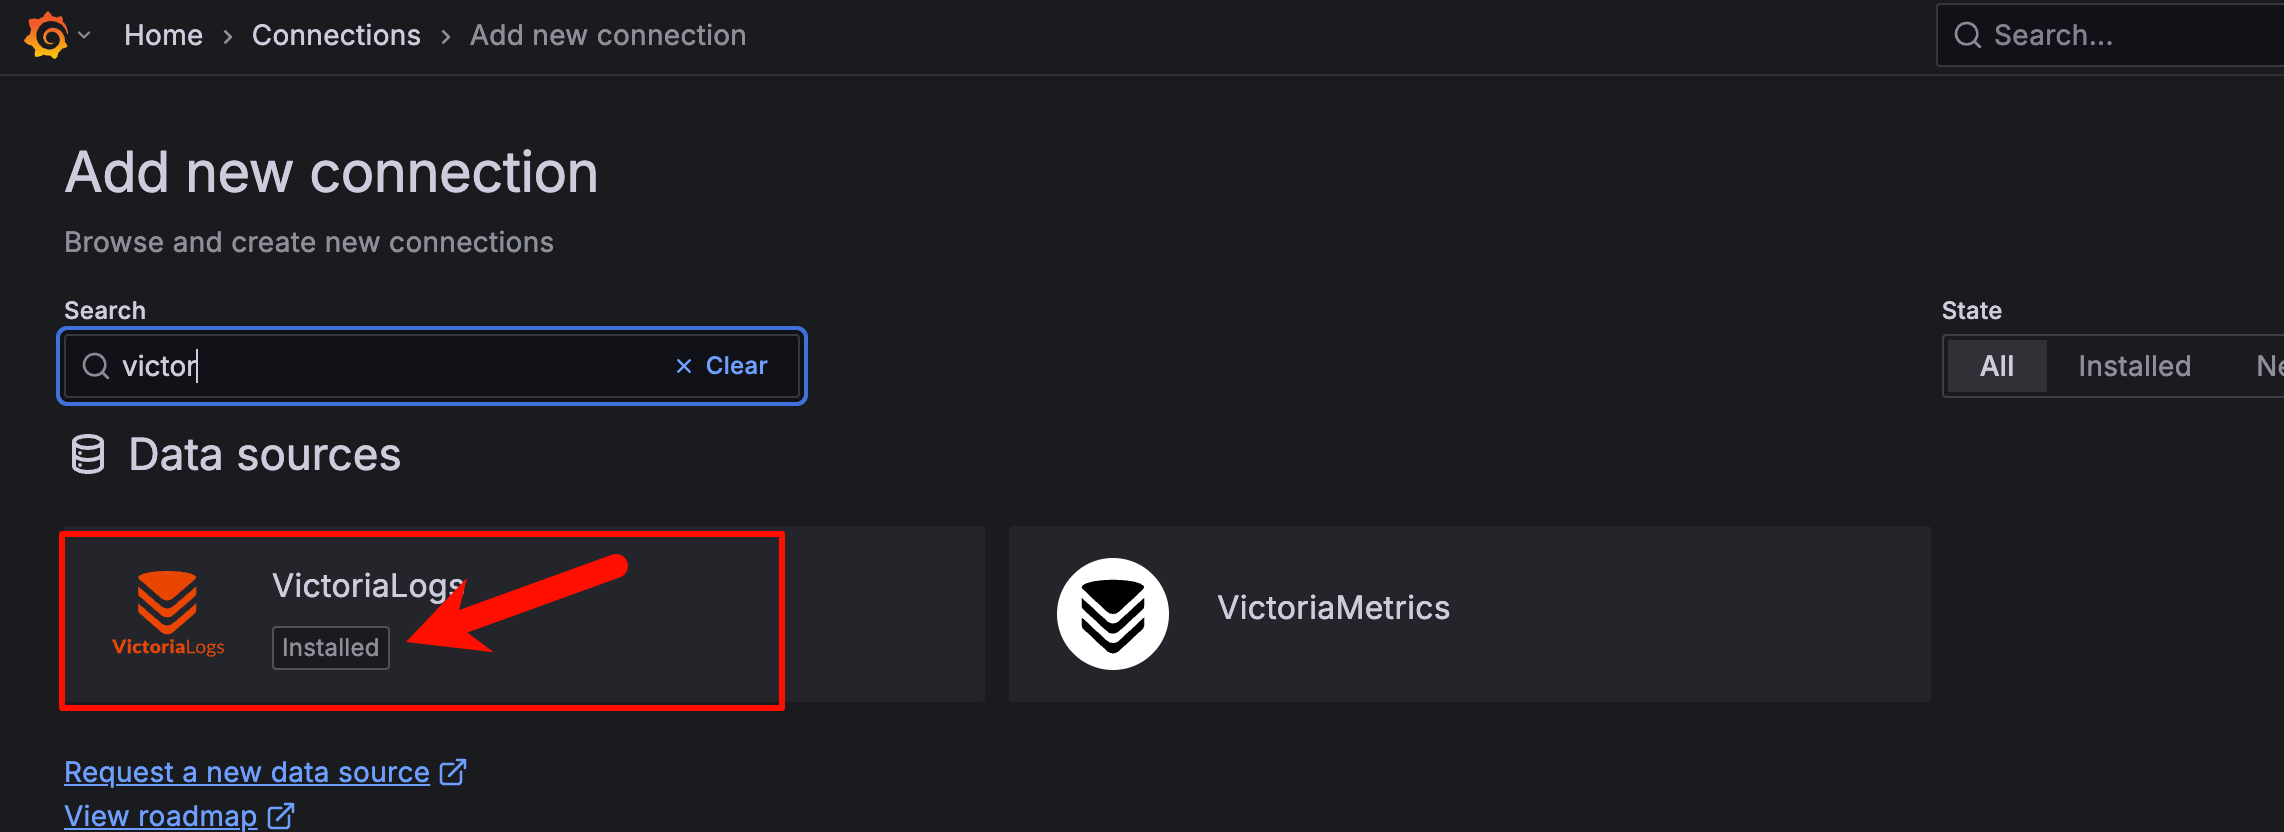
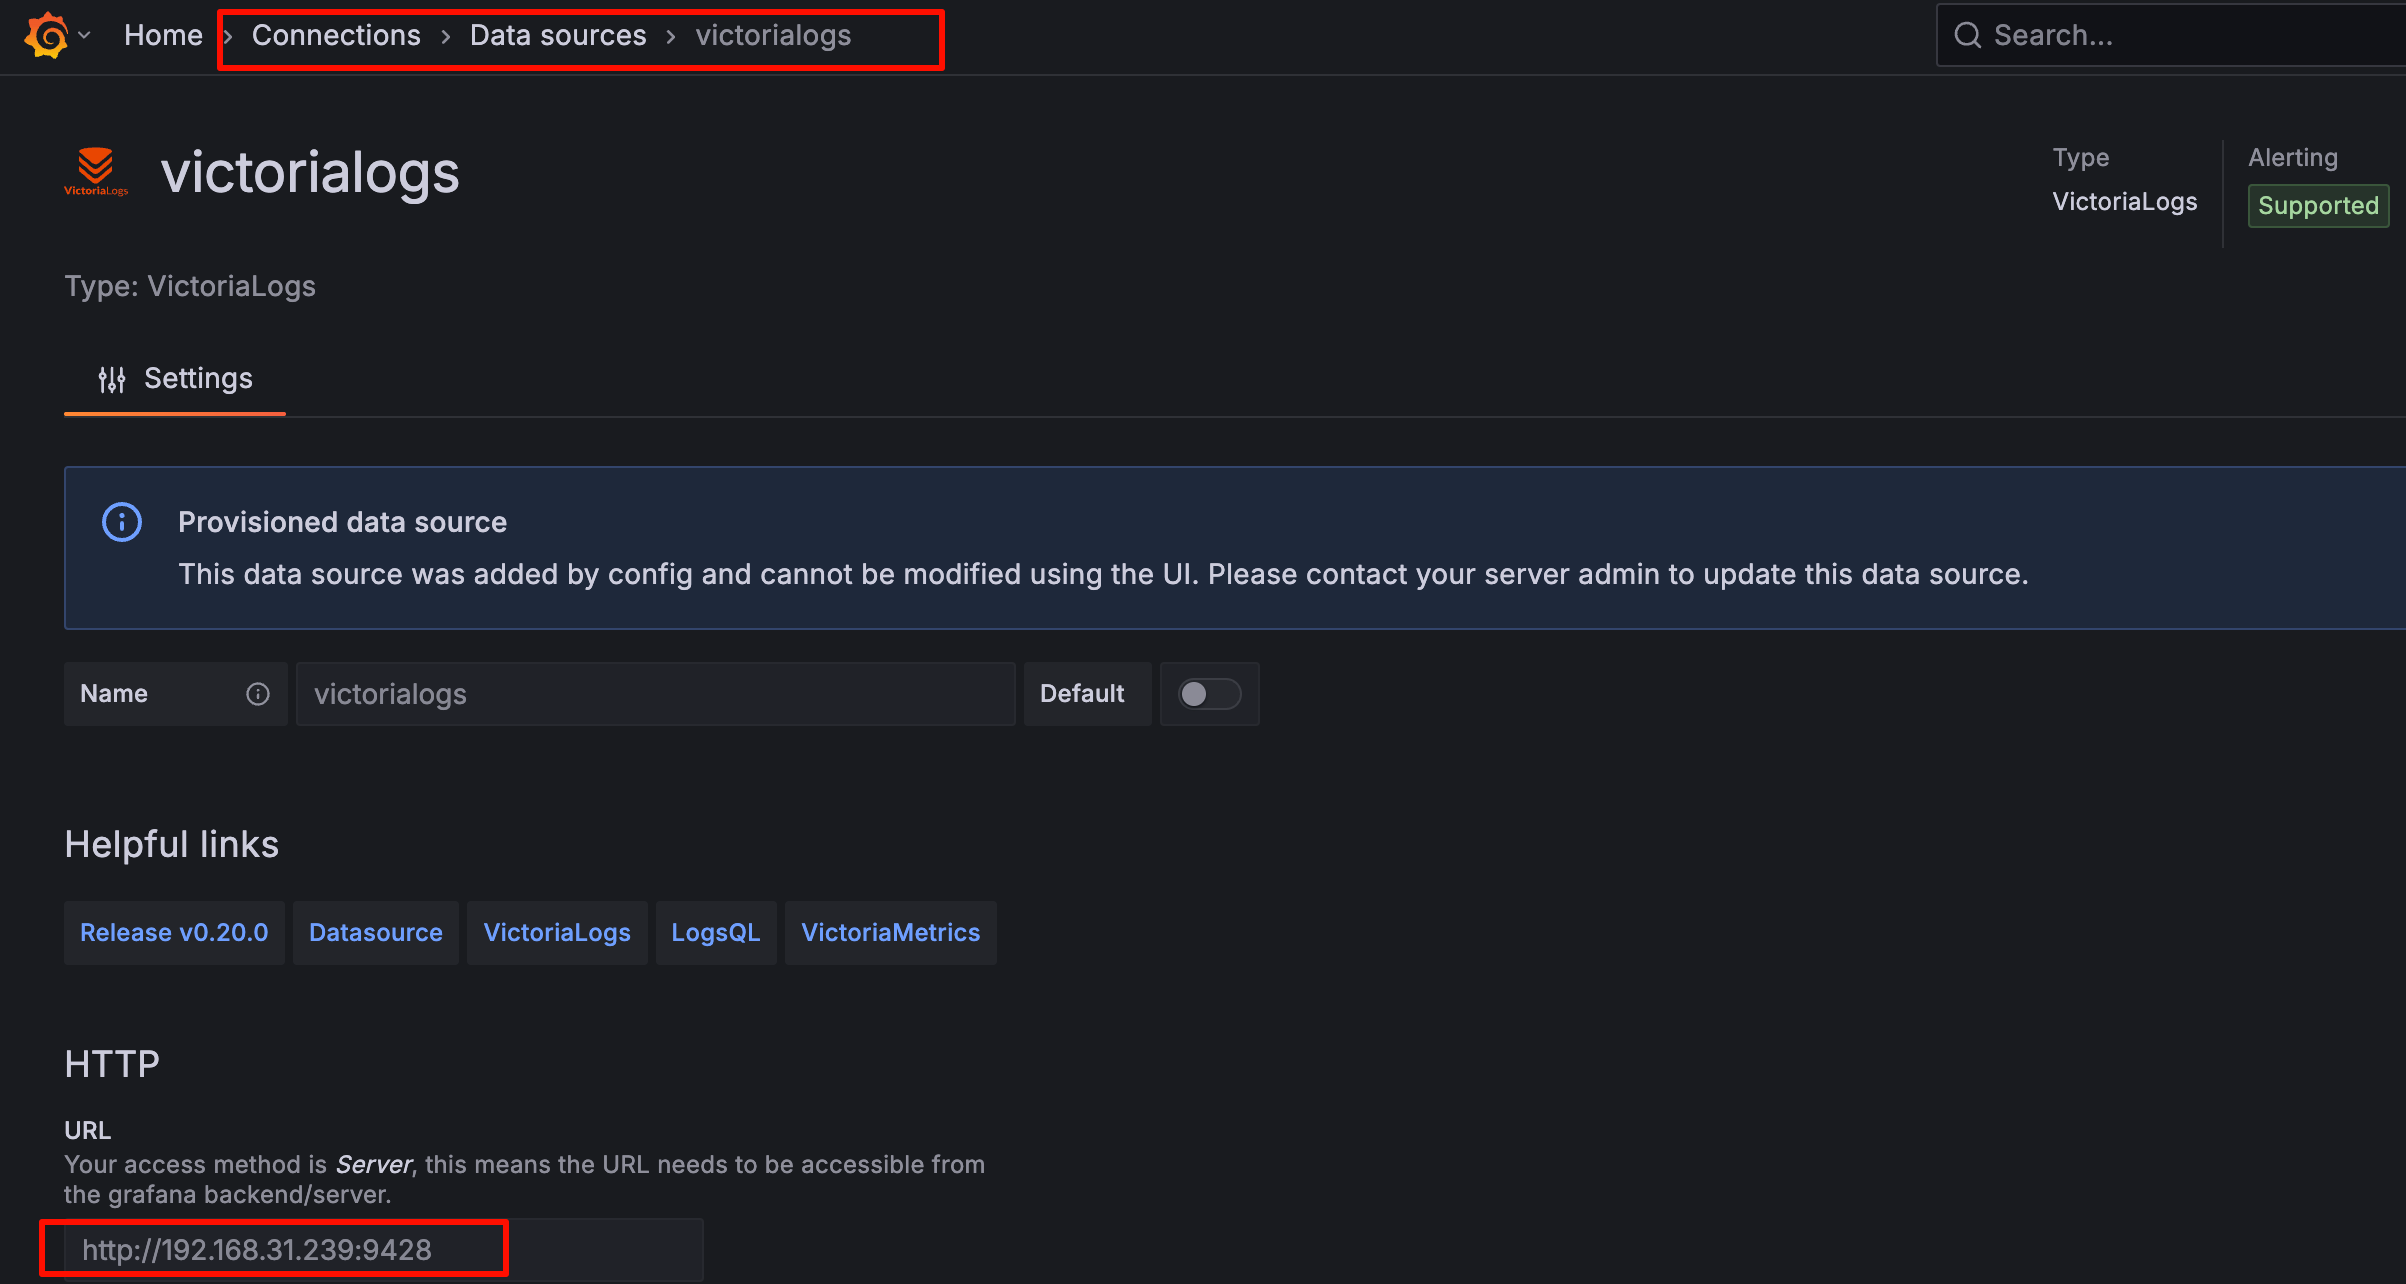
配置data source
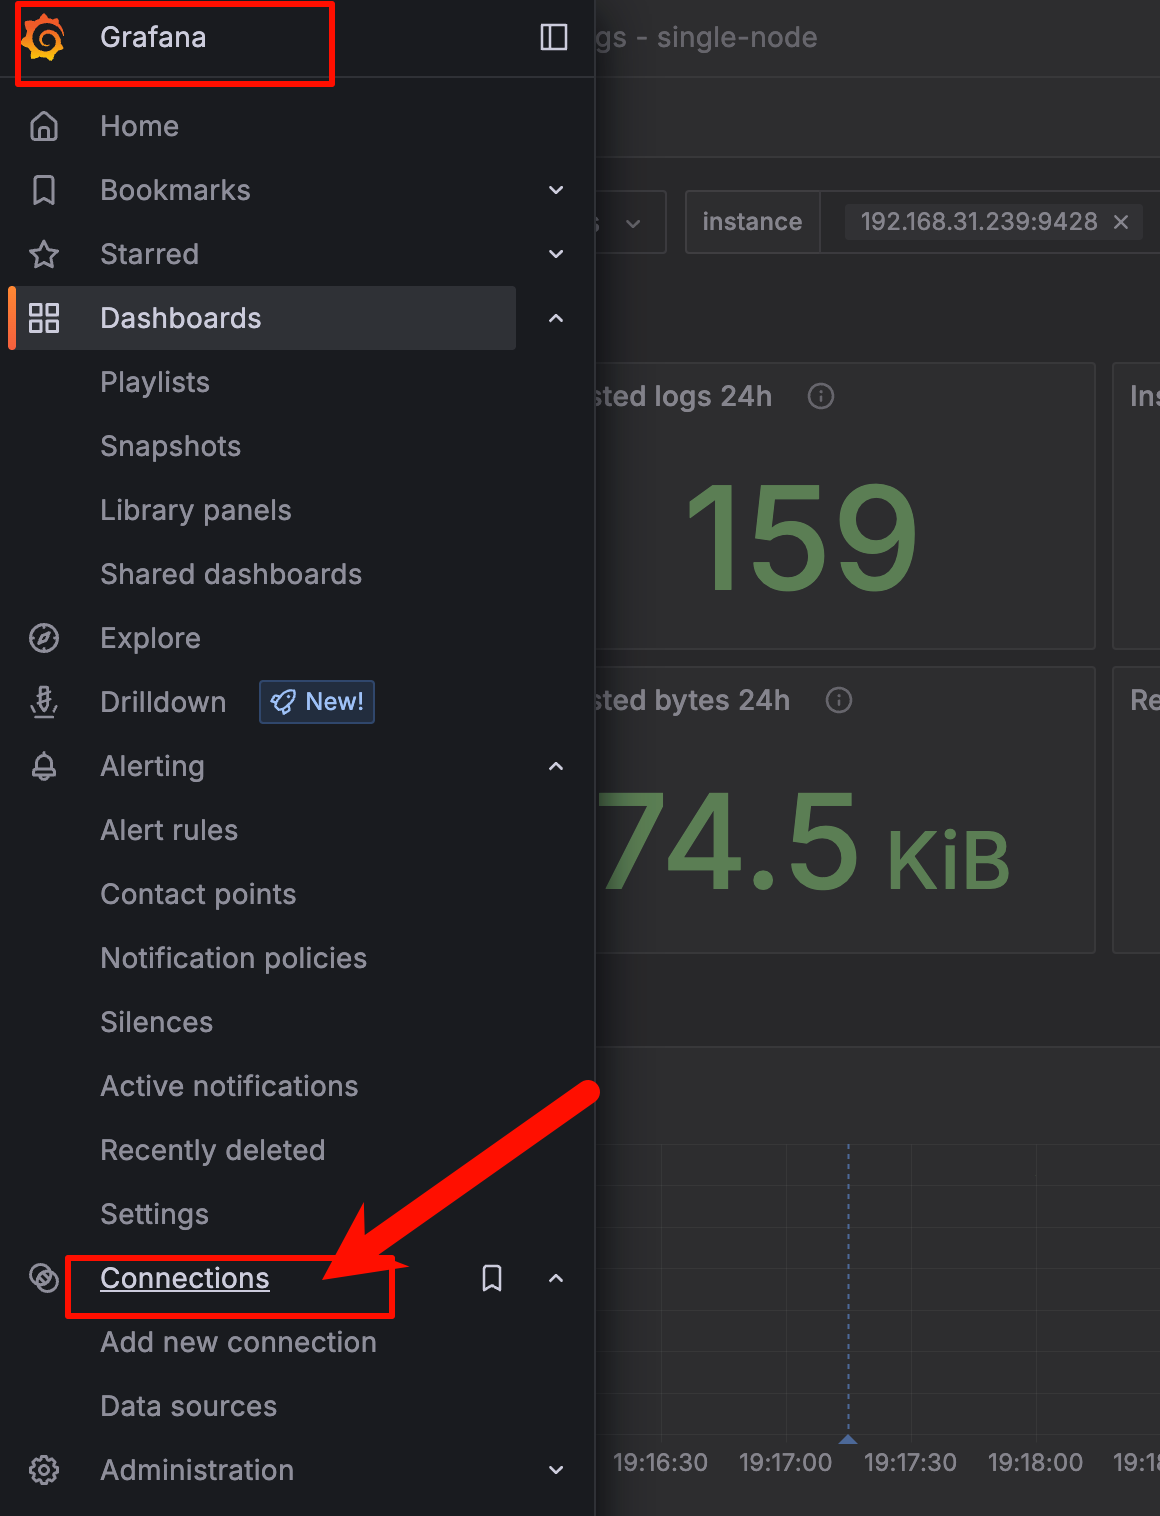
查看plugin 是否已经安装
最后通过grafana查询日志
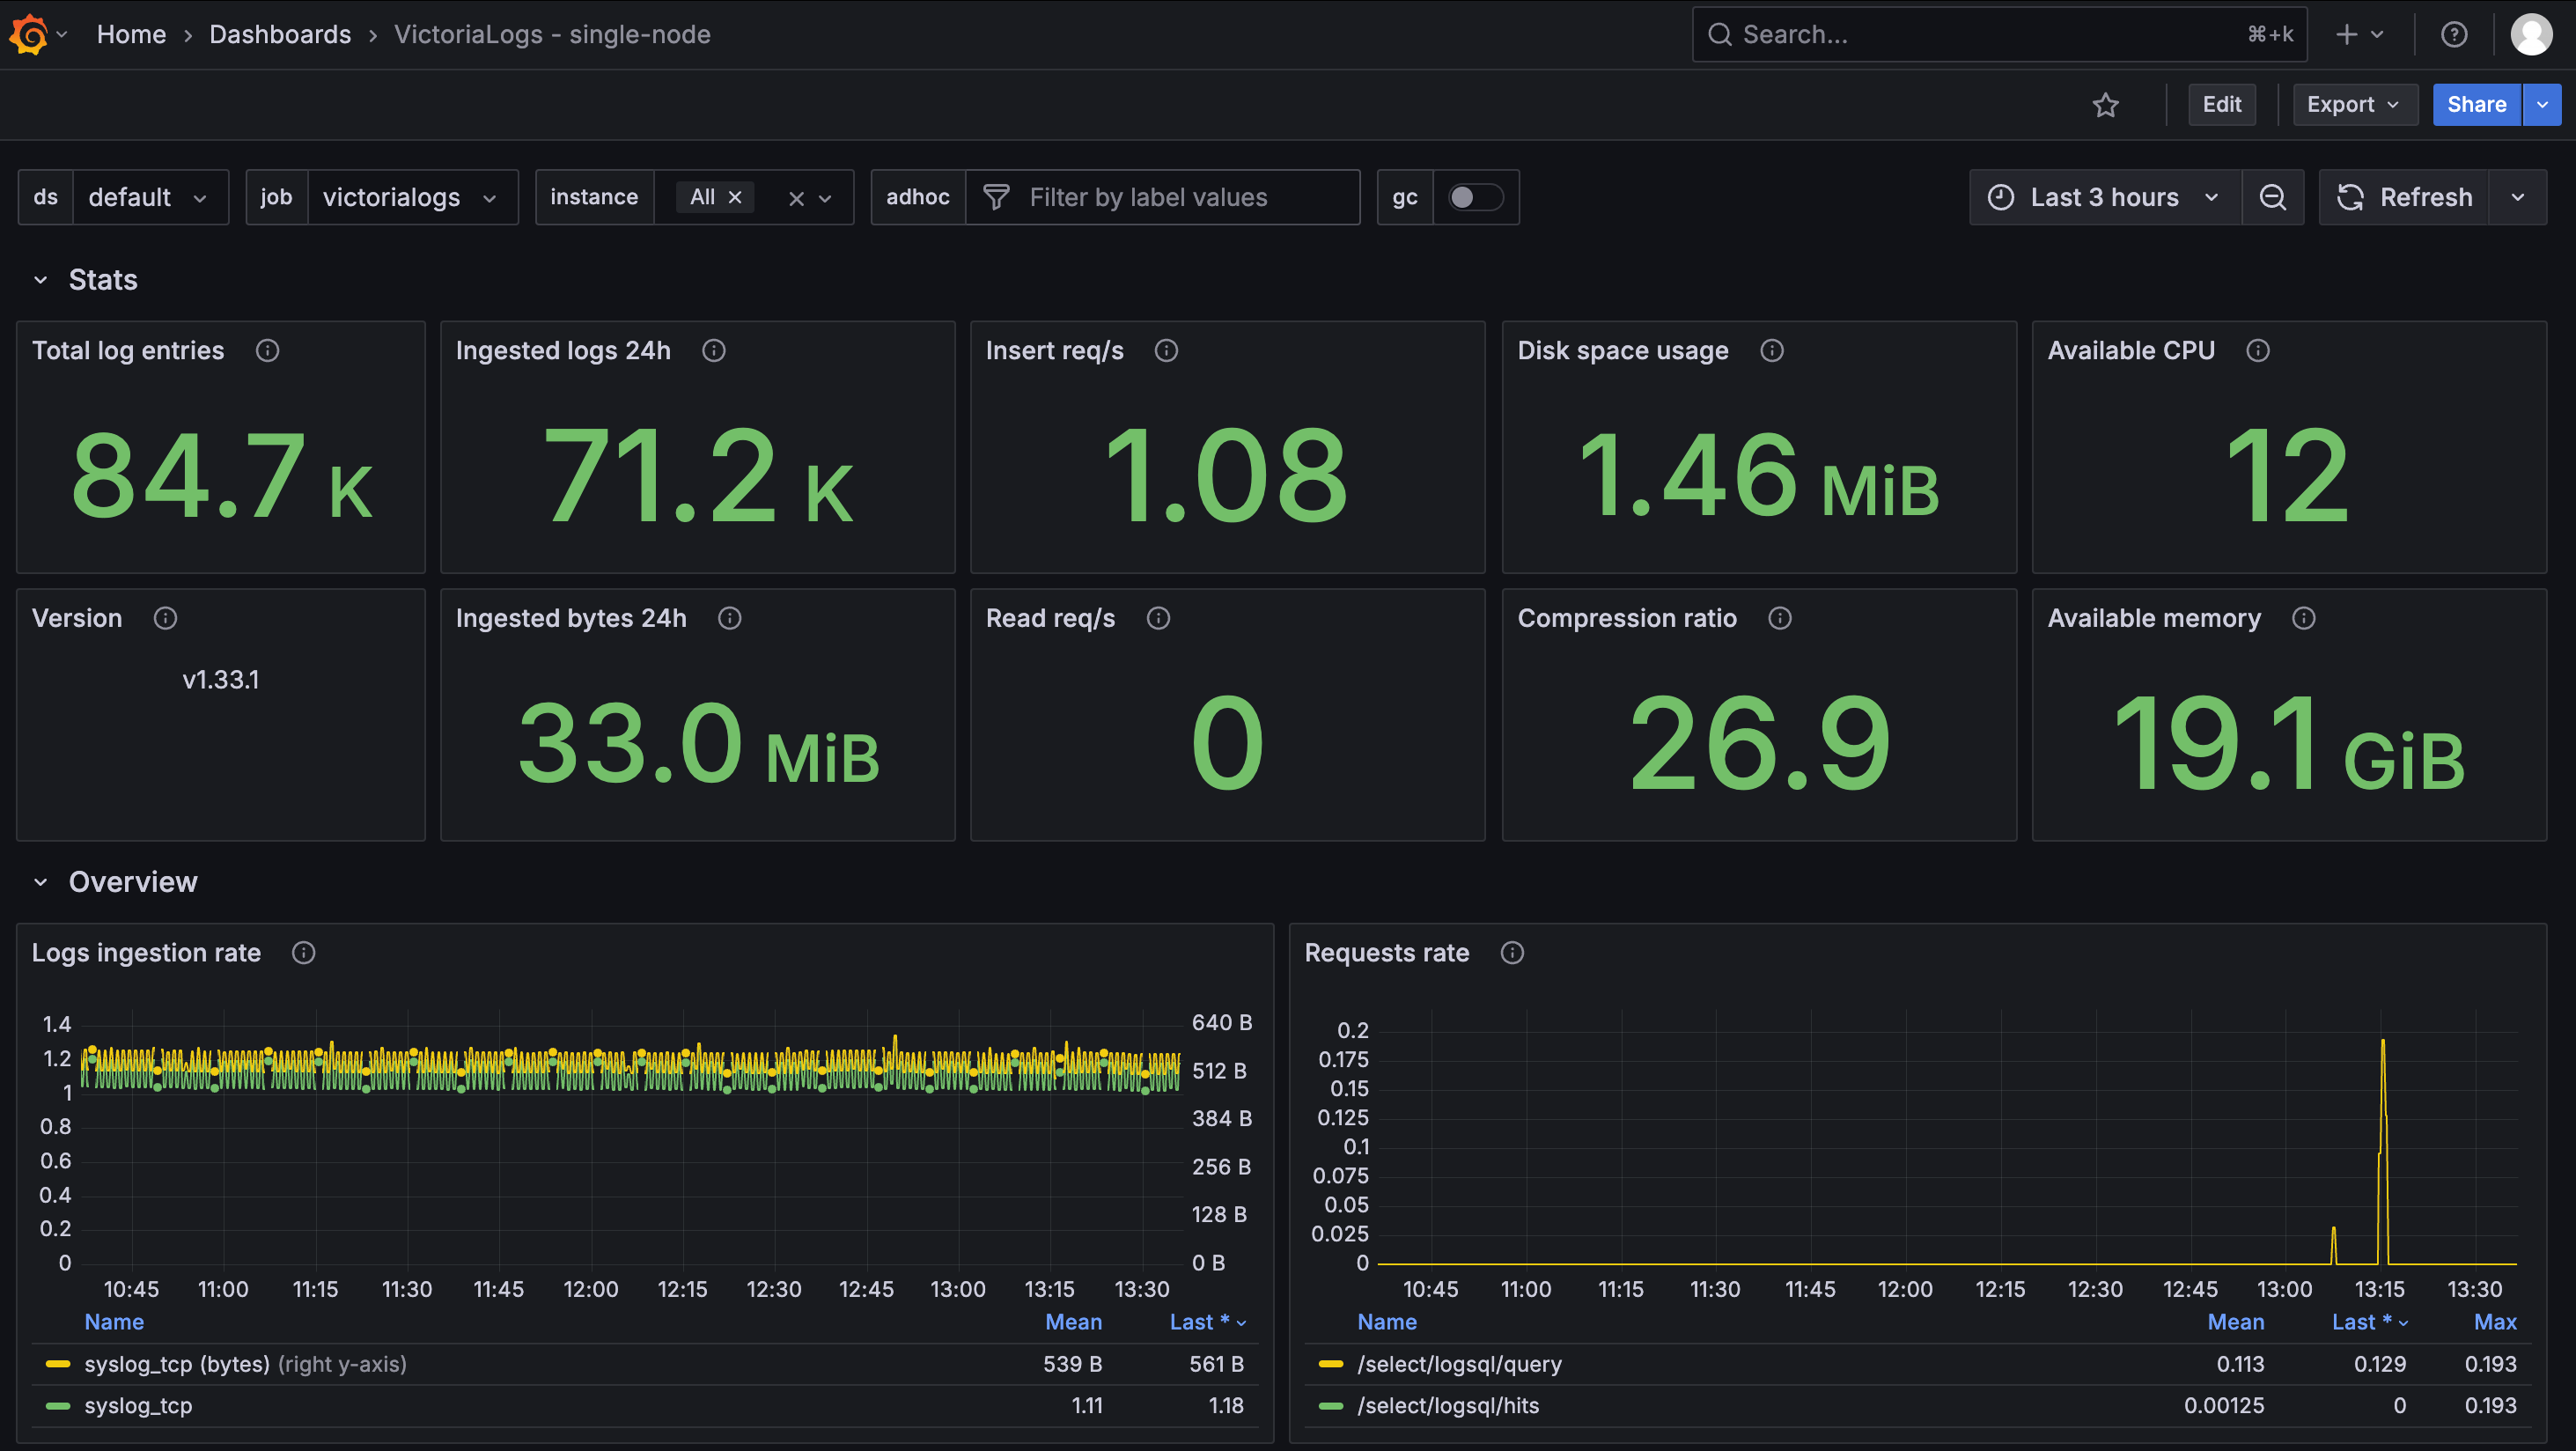
virtorialog 监控
我们通过prometheus进行监控victorialog 日志服务器状态,默认监控metircs,官方已经提供http接口,只需要在prometheus配置一下就可以了
scrape_configs:
  # The job name is added as a label `job=<job_name>` to any timeseries scraped from this config.
  - job_name: "prometheus"

    # metrics_path defaults to '/metrics'
    # scheme defaults to 'http'.

    static_configs:
      - targets: ["localhost:9090"]

  - job_name: "ubuntu"
    static_configs:
      - targets: ['192.168.31.239:9100']
        labels:
          instance: localhost
# virtorialog配置
  - job_name: victorialogs
    metrics_path: "/metrics"
    static_configs:
      - targets: ['192.168.31.239:9428']
首先配置grafana
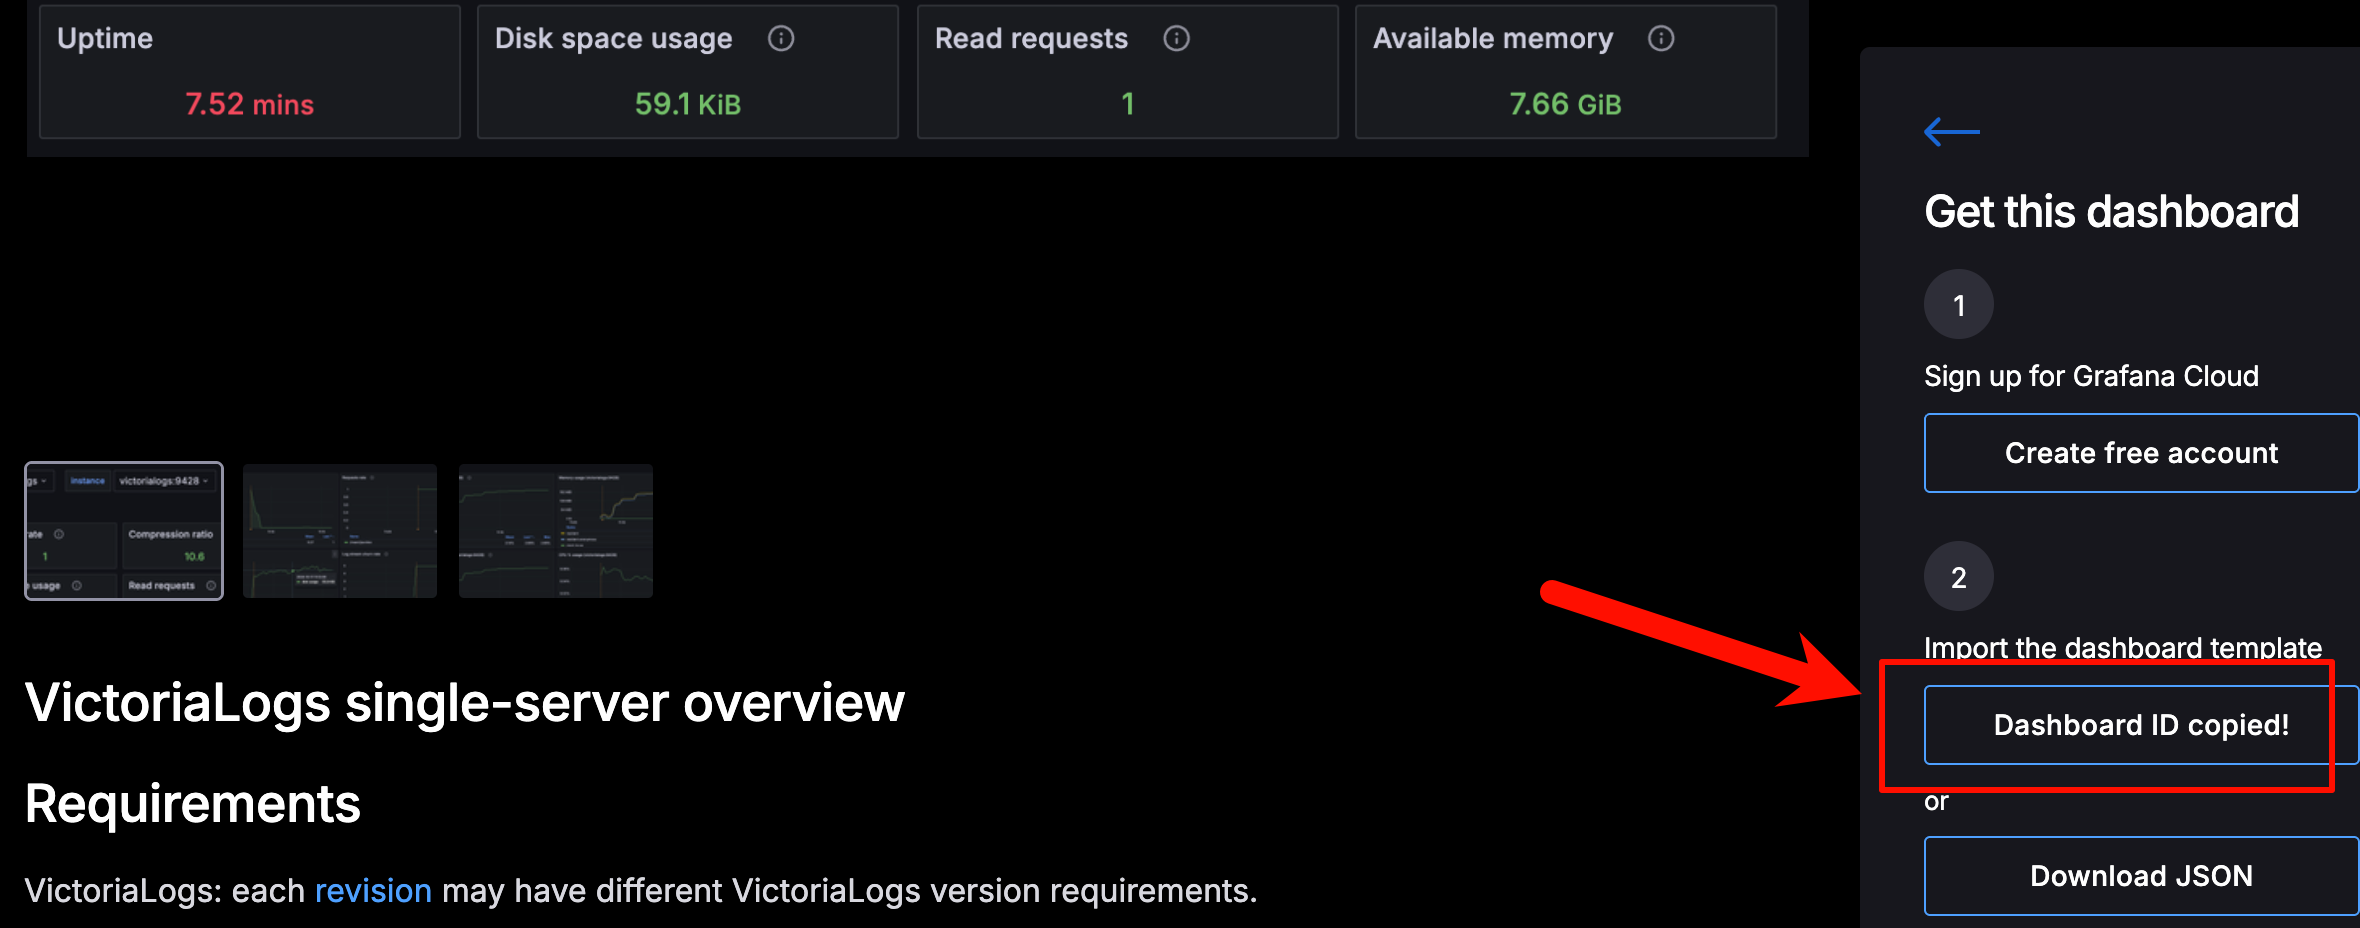
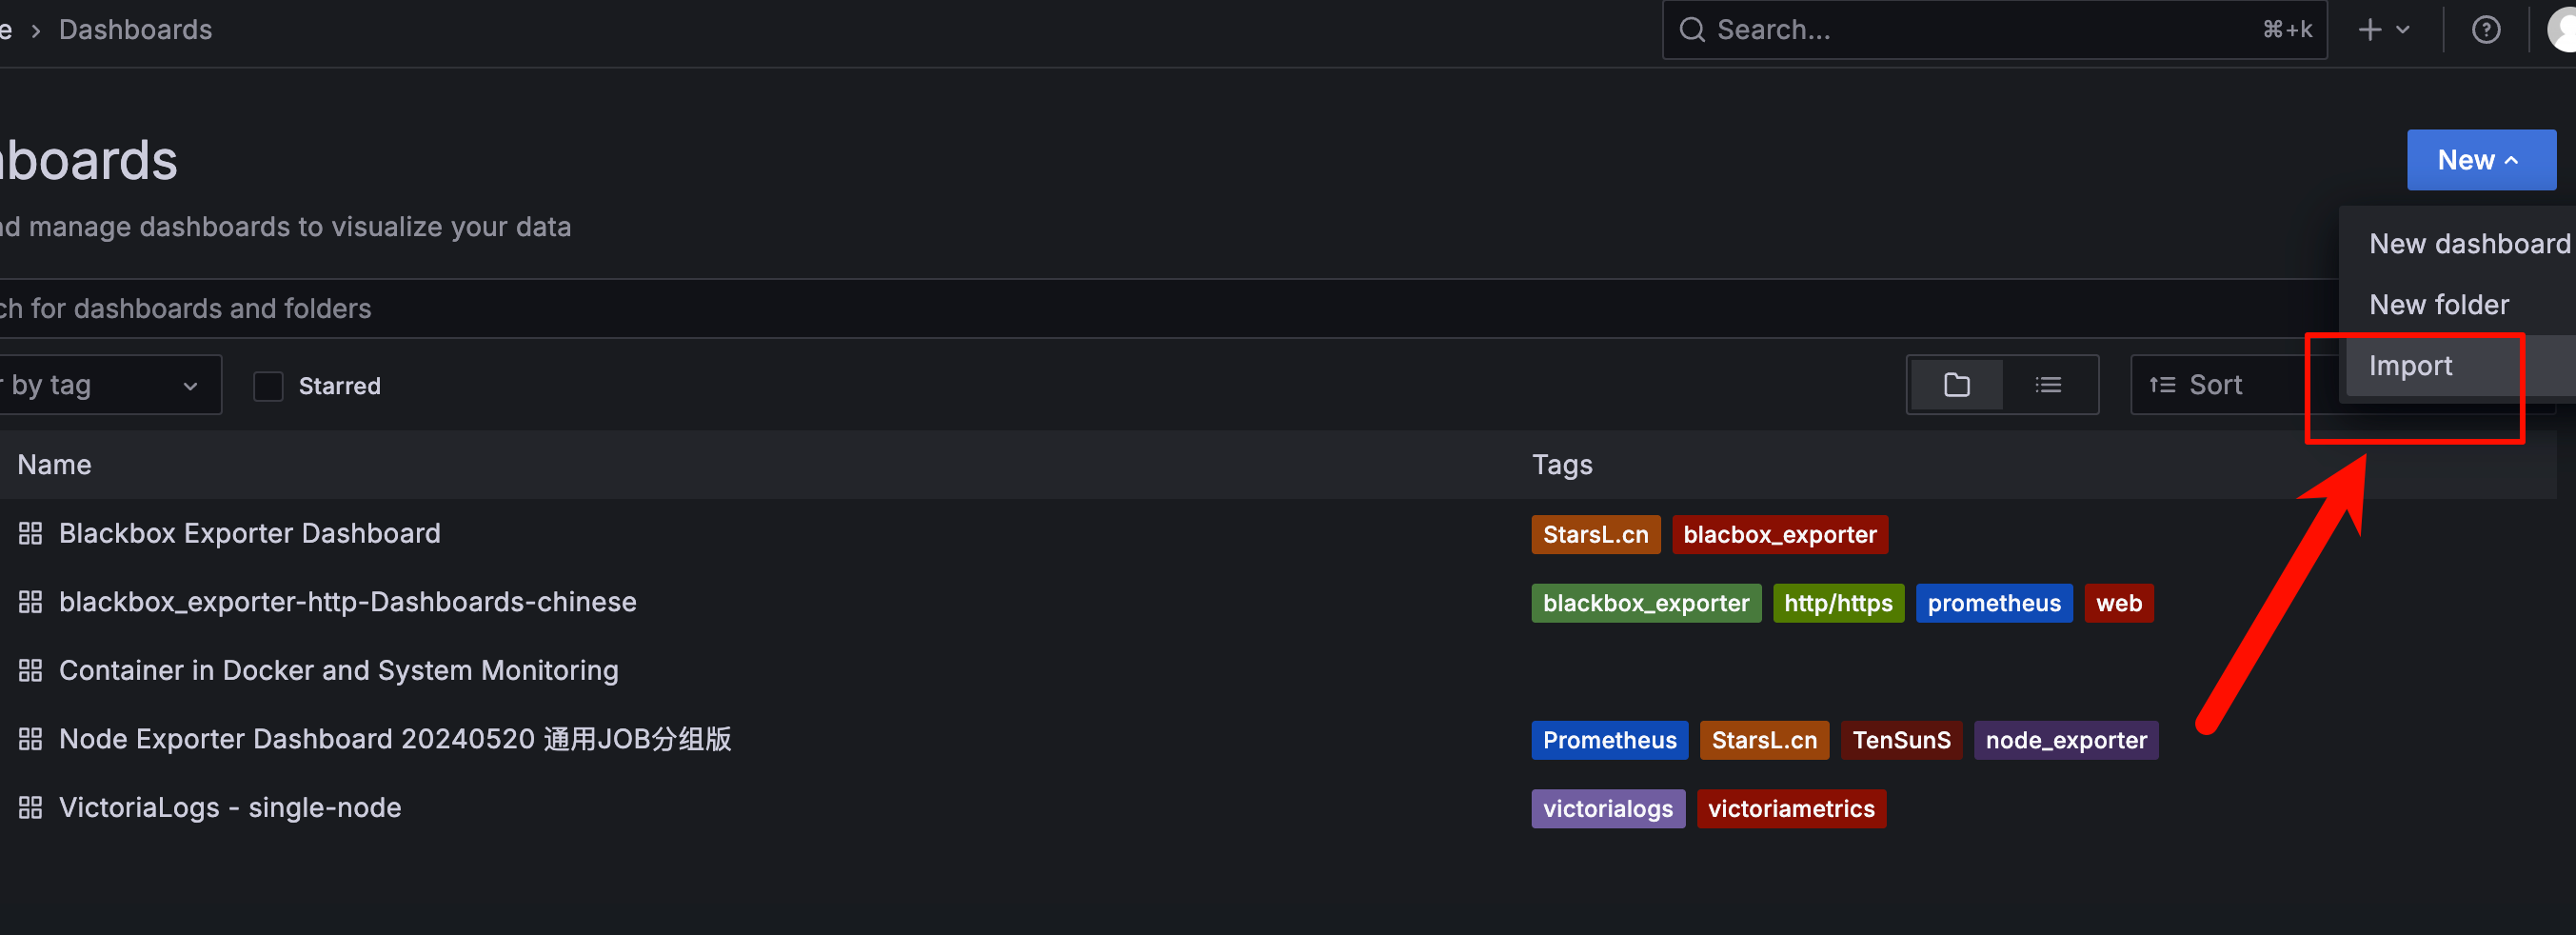
我们需要有一个监控模版,这个可以在官方找到做好的模版,导入到grafana中
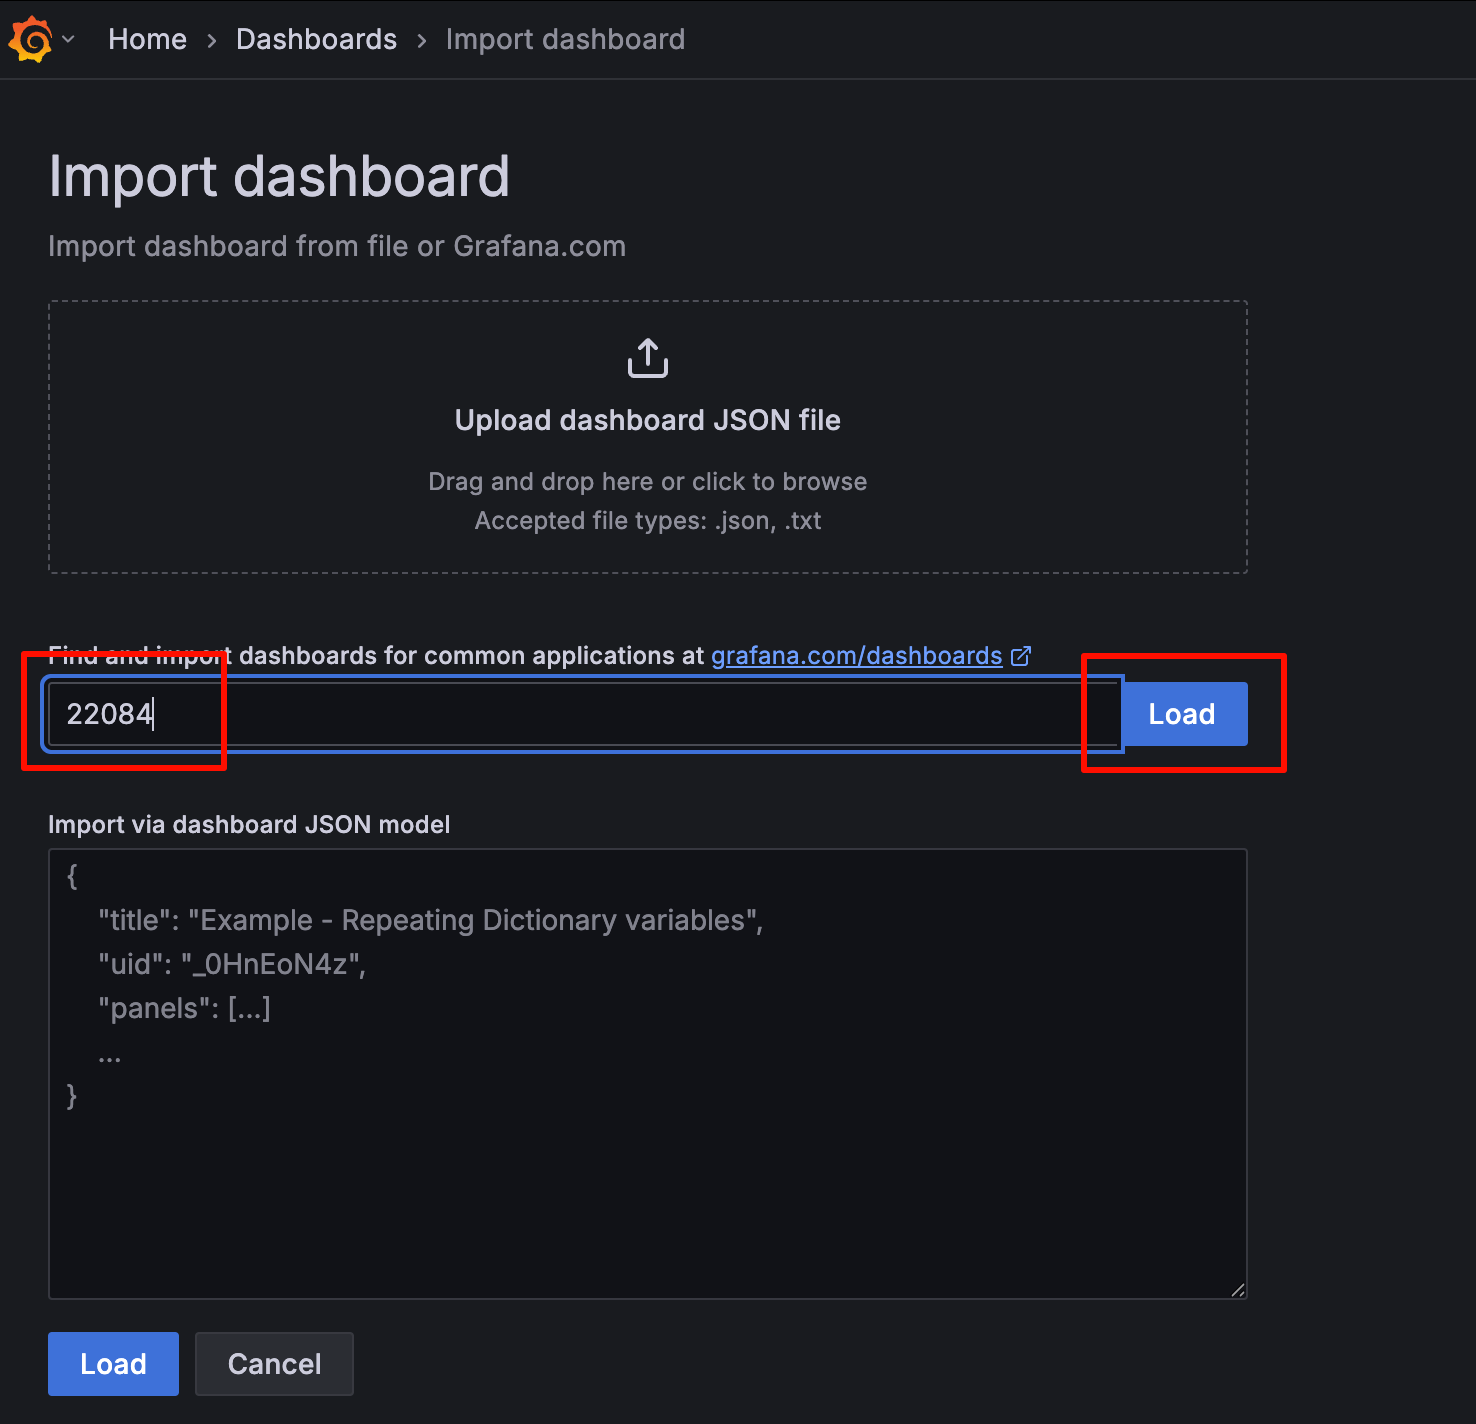
dashboard 导入模版
单节点模版: https://grafana.com/grafana/dashboards/22084-victorialogs-single-node/
监控指标展示